BIOPRINTING
June 19, 2016
If you have read my posts over the past few months you will be very familiar with 3-D printing. “Additive” manufacturing is a disruptive technology that is changing the manner in which components are made. Once again, let us look at the definition of 3 D printing relative to “rapid prototyping”.
A 3D printer is a computer-aided manufacturing (CAM) device that creates three-dimensional objects. Like a traditional printer, a 3D printer receives digital data from a computer as input. However, instead of printing the output on paper, a 3D printer builds a three-dimensional model out of a custom material. (For our purposes, the words “custom materials” are the key words.)
3D printers use a process called additive manufacturing to form (or “print”) physical objects layer by layer until the model is complete. This is different than subtractive manufacturing, in which a machine reshapes or removes material from an existing mold. Since 3D printers create models from scratch, they are more efficient and produce less waste than subtractive manufacturing devices.
There are several viable options available today that take advantage of rapid prototyping technologies. All of the methods shown below are considered to be rapid prototyping and manufacturing technologies.
- (SLA) Stereolithography
- (SLS) Selective Laser Sintering
- (FDM) Fused Deposition Modeling
- (3DP) Three Dimensional Printing
- (Pjet) Poly-Jet
- Laminated Object Manufacturing
The process of “additive” manufacturing is finding more and more uses as the availability of desirable materials improves. At one time, during early phases of 3-D development, materials suitable for printing were very limited with only a few finding acceptance. Even then, most 3-D printing was used to product prototypes and not “workable” goods used for long-term use. That has all changed. Additive manufacturing is now being considered for production as well as prototyping.
The June 2016 edition of “Manufacturing Engineering” had a fascinating article entitled “Bioprinting Helping Researchers Understand How Cells Work”. Bioprinting is a new word to me with a definition as follows:
“ Bioprinting is the three-dimensional printing of biological tissue and organs through layering of living cells. While this area of manufacturing is still in the experimental stage and is currently used primarily in scientific study rather than applied science, the possibility of creating functional replacement tissues or organs could one day transform medical treatment.”
Every day new applications for 3D printing are being discovered. Whether it’s 3D printing drones with the electronics built into them, or 3D printing human tissue for drug toxicity testing, the research being done and discoveries being made are often times unbelievable. The area of 3D bioprinting is probably one of the most interesting applications of additive manufacturing. It’s quite clear that someday in the not too distant future many of us will eventually have 3D printed body parts both inside and outside our bodies. The prospects of bioprinting are staggering. As the technology develops over the coming decades, individuals will begin receiving bioprinted organs and other biological components, there is no doubt that the term ‘bioprinting’ will become a commonly used word within the English vocabulary.
Bioprinting begins with creating an architectural design based on the fundamental composition of the target tissue or organ. Pre-bioprinting is the process of creating a model that the printer will use to later create and choose the materials that will be used. One of the first steps is to obtain a biopsy of the organ. The common technologies used for bioprinting are computed tomography (CT) and magnetic resonance imaging (MRI). In order to print with a layer-by-layer approach, tomographic reconstruction is done on the images. The now-2D images are then sent to the printer to be made. Once the image is created, certain cells are isolated and multiplied. These cells are then mixed with a special liquefied material that provides oxygen and other nutrients to keep them alive. In some processes, the cells are encapsulated in cellular spheroids 500μm in diameter. This aggregation of cells does not require a scaffold, and are required for placing in the tubular-like tissue fusion for processes such as extrusion. In a laboratory environment, a bioprinter then uses that design and deposits thin layers of cells using a bioprint head, which moves either left and right or up and down in the required configuration. Bioprinters use bio-ink, or bioprocess protocols, to build these organic materials. They also dispense a dissolvable hydrogel to support and protect cells as tissues are constructed vertically, to act as fillers to fill empty spaces within the tissues.
As you can imagine, the equipment used to bioprint human parts is remarkably specialized and used within a clean room environment to eliminate infection of the part or organ when surgically applied to a patient. The three digital photographs below will illustrate two applications of equipment.


As mentioned earlier, bioprinting , for the time being, is experimental in nature but very very promising. Considerable work is being accomplished to bring this form of additive manufacturing to the medical field. The nose and ear shown below indicate two body parts that will be surgically applied to an individual.

For more information on bioprinting, please log into the following web pages:
- America Makes
- BioBots
- Bioprinting (Journal)
- Cellink
- Cyfuse Biomedical
- International Journal of Bioprinting
- Lux Research
- MicroFab Technologies
- Penn State University
- SME
- Te Vido Biodevices
- US Food and Drug Administration
- Wake Forest Institute for Regenerative Medicine
As always, I welcome your comments.
NO PLACE TO HIDE
June 15, 2016
The past two years, 2015 and 2016, have been extremely difficult years for our country relative to terrorist attacks. Let’s take a look.
- 3 May 2015–Garland, Texas, two (2) killed, one (1) injured.
- 17 Jun 2015–Charleston, South Carolina, nine (9) killed, one (1) injured
- 16 Jul 2015—Chattanooga, Tennessee (my home town), six (6) killed, two (2) injured
- 4 Nov 2015–Merced, California, one (1) killed, four (4) injured
- 27 Nov 2015—Colorado Springs, Colorado—three (3) killed, nine (9) injured
- 3 Dec 2015–San Bernardino, California, sixteen (16) killed, twenty-three (23) injured
- 7 Jan 2016–Philadelphia, Pennsylvania, zero (0) killed, two (2) injured
- 11 Feb 2016–Columbus, Ohio, one (1) killed, four (4) injured
- 12 June 2016—Orlando, Florida, one (1) killed, zero (0) injured
- 13 June 2016—Orlando, Florida, forty-nine (49) killed, fifty-three (53) injured.
REALITY:
Now, to be fair, not all of these attacks were inspired by Islamic extremists, but we have come to realize Islamic terrorism is a horrible blight on our nation. The map below is one of the scariest representations of reality I have seen in quite some time.

In 2015 the Federal Bureau of Investigation (FBI) had at least 1,000 ongoing investigations involving the Islamic State of Iraq and Syria or ISIS. All of these are inside the United States.
According to FBI reports, terrorists are actively recruiting in all 50 states, primarily using social media. Currently, the FBI is investigating over 900 different potential terror plots in the United States alone. Over 9,500 immigrants have their visas revoked over terrorist activity. Their whereabouts in the U.S. are unknown—that’s right, unknown. This in itself is extremely disturbing, but that is reality. We simply have lost the whereabouts of 9,500 immigrants. These we know about but what about the numbers we do not know about. What about all those terrorists and terrorists’ plots that have slipped through the cracks?
SAFEST COUNTRIES:
Well, maybe there is a place, or places, we can hide or at least be assured of relative safety. The Institute for Economics and Peace (IEP) recently published the ninth list of the safest countries in the world, as follows:
- ICELAND
- DENMARK
- AUSTRIA
- NEW ZELAND
- SWITZERLAND
- FINLAND
- CANADA
- JAPAN
- AUSTRALIA
- CZECH REPUBLIC
- PORTUGAL
- IRELAND
- SWEDEN
- BELGIUM
- SLOVENIA
- GERMANY
- NORWAY
- BHUTAN
- POLAND
- NETHERLANDS
A publication called The Global Peace Index (GPI) ranks the nations of the world according to their level of peacefulness. The index is composed of twenty-three (23) qualitative and quantitative indicators from highly respected sources and ranks 162 independent states, covering 99.6 per cent of the world’s population. The index gauges global peace using three broad themes: the level of safety and security in society, the extent of domestic and international conflict and the degree of militarization. You will notice the United States is not in the top twenty (20) countries in which safety can be counted on. I think this is really disturbing.
ECONOMIC GLOBAL IMPACT:
I do not wish to be cold-hearted but there is an economic impact to violent across the world and certainly the United States.
The economic impact of violence on the global economy in 2014 was substantial and is estimated at US $14.3 trillion or 13.4 per cent of world GDP. This is equivalent to the combined economies of Brazil, Canada, France, Germany, Spain and the United Kingdom. Since 2008, the total economic impact on global GDP has increased by 15.3 per cent, from US $12.4 trillion to US $14.3 trillion. Large increases in costs are due to the increases in deaths from internal conflict, increases for IDP and refugee support, and GDP losses from conflict, with the latter accounting for thirty-eight percent (38%) of the increase since 2008. The major expenditure categories are military spending at forty-three percent (43), homicide and violent crime at twenty-seven percent (27%) and internal security officers, including police, at eighteen percent (18%). While the cost of UN peacekeeping has more than doubled since 2008, it still only accounts for less than 0.17 per cent of violence containment expenditure on a global basis. A huge sum of money.
The US alone now spends about US $500 billion annually—twenty percent (20% of the US federal budget–on departments directly engaged in combating or preventing terrorism, most notably Defense and Homeland Security. The Defense budget increased by one-third, or over $100 billion, from 2001 to 2003 in response to the heightened sense of the threat of terrorism – an increase equivalent to 0.7 per cent of US GDP. Expenditures on defense and security are essential for any nation, but of course they also come with an opportunity cost; those resources are not available for other purposes, from spending on health and education to reductions in taxes. A higher risk of terrorism, and the need to combat it, simply raises that opportunity cost.
CONCLUSIONS:
We certainly live in very difficult times and seemingly, the three branches of our government do NOT know how to effectively prevent future acts and yet, there are successes.
In 2007, The Heritage Foundation began tracking post-9/11terrorist plots against the United States. Heritage continuously refines and updates the available information, and in light of the Boston Marathon bombing, is now including not only thwarted plots, but those that have been successful.
In 2012, Heritage reported that at least fifty (50) publicly known, Islamist-inspired terrorist plots against the homeland had been thwarted since September 11, 2001. The reality, of course, is that no matter how good a nation’s security and intelligence agencies are, they cannot prevent one hundred (100) percent of planned attacks. Of the sixty (60) plots, forty-nine (49) could be considered homegrown terror plots. This means that one or more of the actors were American citizens, legal permanent residents, or visitors radicalized predominately in the United States.
In each of these plots, the number one target was military facilities, followed closely by targets in New York City. The third most common target was mass gatherings, like the Boston Marathon, nightclubs and bars, and shopping malls. We have just experienced that with the shooting in Florida. There are successes but we have been told our enemies are coming after us and with a vengeance. It is still imperative that city, state and federal governments work together to insure public safety and do so in a very proactive manner.
As always, I welcome your comments.
MOORE’S LAW
June 10, 2016
There is absolutely no doubt the invention and development of chip technology has changed the world and made possible a remarkable number of devices we seemingly cannot live without. It has also made possible miniaturization of electronics considered impossible thirty years ago. This post is about the rapid improvement that technology and those of you who read my posts are probably very familiar with Moor’s Law. Let us restate and refresh our memories.
“Moore’s law” is the observation that, over the history of computing hardware, the number of transistors in a dense integrated circuit has doubled approximately every two years.”
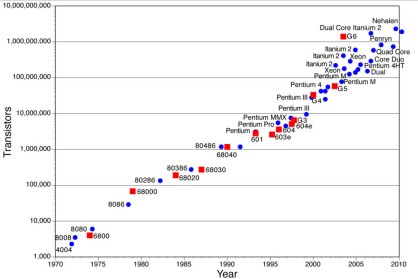
You can see from the digital above, that law is represented in graph form with the actual “chip” designation given. Most people will be familiar with Moore’s Law, which was not so much a law, but a prediction given by Intel’s Gordon Moore. His theory was stated in 1965. Currently, the density of components on a silicon wafer is close to reaching its physical limit but there are promising technologies that should supersede transistors to overcome this “shaky” fact. Just who is Dr. Gordon Moore?
GORDON E. MOORE:
Gordon Earle Moore was born January 3, 1929. He is an American businessman, co-founder and Chairman Emeritus of Intel Corporation, and the author of Moore’s law. Moore was born in San Francisco, California, and grew up in nearby Pescadero. He attended Sequoia High School in Redwood City and initially went to San Jose State University. After two years he transferred to the University of California, Berkeley, from which he received a Bachelor of Science degree in chemistry in 1950.
In September, 1950 Moore matriculated at the California Institute of Technology (Caltech), where he received a PhD in chemistry and a minor in physics, all awarded in 1954. Moore conducted postdoctoral research at the Applied Physics Laboratory at Johns Hopkins University from 1953 to 1956.
Moore joined MIT and Caltech alumnus William Shockley at the Shockley Semiconductor Laboratory division of Beckman Instruments, but left with the “traitorous eight“, when Sherman Fairchild agreed to fund their efforts to created the influential Fairchild Semiconductor corporation.
In July 1968, Robert Noyce and Moore founded NM Electronics which later became Intel Corporation where he served as Executive Vice President until 1975. He then became President. In April 1979, Moore became Chairman of the Board and Chief Executive Officer, holding that position until April 1987, when he became Chairman of the Board. He was named Chairman Emeritus of Intel Corporation in 1997. Under Noyce, Moore, and later Andrew Grove, Intel has pioneered new technologies in the areas of computer memory, integrated circuits and microprocessor design. A picture of Dr. Moore is given as follows:

JUST HOW DO YOU MAKE A COMPUTER CHIP?
We are going to use Intel as our example although there are several “chip” manufacturers in the world. The top ten (10) are as follows:
- INTEL = $48.7 billion in sales
- Samsung = $28.6 billion in sales
- Texas Instruments = $14 billion in sales.
- Toshiba = $12.7 billion in sales
- Renesas = $ 10.6 billion in sales
- Qualcomm = $10.2 billion in sales
- ST Microelectronics = $ 9.7 billion in sales
- Hynix = $9.3 billion in sales
- Micron = $7.4 billion in sales
- Broadcom = $7.2 billion in sales
As you can see, INTEL is by far the biggest, producing the greatest number of computer chips.
The deserts of Arizona are home to Intel’s Fab 32, a $3 billion factory that is performing one of the most complicated electrical engineering feats of our time. It’s here that processors with components measuring just forty-five (45) millionths of a millimeter across are manufactured, ready to be shipped to motherboard manufacturers all over the world. Creating these complicated miniature systems is impressive enough, but it’s not the processors’ diminutive size that’s the most startling or impressive part of the process. It may seem an impossible transformation, but these fiendishly complex components are made from nothing more glamorous than sand. Such a transformative feat isn’t simple. The production process requires more than three hundred (300) individual steps.
STEP ONE:
Sand is composed of silica (also known as silicon dioxide), and is the starting point for making a processor. Sand used in the building industry is often yellow, orange or red due to impurities, but the type chosen in the manufacture of silicon is a much purer form known as silica sand, which is usually recovered by quarrying. To extract the element silicon from the silica, it must be reduced (in other words, have the oxygen removed from it). This is accomplished by heating a mixture of silica and carbon in an electric arc furnace to a temperature in excess of 2,000°C. The carbon reacts with the oxygen in the molten silica to produce carbon dioxide (a by-product) and silicon, which settles in the bottom of the furnace. The remaining silicon is then treated with oxygen to reduce any calcium and aluminum impurities. The end result of this process is a substance referred to as metallurgical-grade silicon, which is up to ninety-nine percent (99 %) pure.
This is not nearly pure enough for semiconductor manufacture, however, so the next job is to refine the metallurgical-grade silicon further. The silicon is ground to a fine powder and reacted with gaseous hydrogen chloride in a fluidized bed reactor at 300°C giving a liquid compound of silicon called trichlorosilane.
Impurities such as iron, aluminum, boron and phosphorous also react to give their chlorides, which are then removed by fractional distillation. The purified trichlorosilane is vaporized and reacted with hydrogen gas at 1,100°C so that the elemental silicon is retrieved.
During the reaction, silicon is deposited on the surface of an electrically heated ultra-pure silicon rod to produce a silicon ingot. The end result is referred to as electronic-grade silicon, and has a purity of 99.999999 per cent. (Incredible purity.)
STEP TWO:
Although pure to a very high degree, raw electronic-grade silicon has a polycrystalline structure. In other words, it’s made of many small silicon crystals, with defects called grain boundaries. Because these anomalies affect local electronic behavior, polycrystalline silicon is unsuitable for semiconductor manufacturing. To turn it into a usable material, the silicon must be transformed into single crystals that have a regular atomic structure. This transformation is achieved through the Czochralski Process. Electronic-grade silicon is melted in a rotating quartz crucible and held at just above its melting point of 1,414°C. A tiny crystal of silicon is then dipped into the molten silicon and slowly withdrawn while being continuously rotated in the opposite direction to the rotation of the crucible. The crystal acts as a seed, causing silicon from the crucible to crystallize around it. This builds up a rod – called a boule – that comprises a single silicon crystal. The diameter of the boule depends on the temperature in the crucible, the rate at which the crystal is ‘pulled’ (which is measured in millimeters per hour) and the speed of rotation. A typical boule measures 300mm in diameter.
STEP THREE:
Integrated circuits are approximately linear, which is to say that they’re formed on the surface of the silicon. To maximize the surface area of silicon available for making chips, the boule is sliced up into discs called wafers. The wafers are just thick enough to allow them to be handled safely during semiconductor fabrication. 300mm wafers are typically 0.775mm thick. Sawing is carried out using a wire saw that cuts multiple slices simultaneously, in the same way that some kitchen gadgets cut an egg into several slices in a single operation.
Silicon saws differ from kitchen tools in that the wire is constantly moving and carries with it a slurry of silicon carbide, the same abrasive material that forms the surface of ‘wet-dry’ sandpaper. The sharp edges of each wafer are then smoothed to prevent the wafers from chipping during later processes.
Next, in a procedure called ‘lapping’, the surfaces are polished using an abrasive slurry until the wafers are flat to within an astonishing 2μm (two thousandths of a millimeter). The wafer is then etched in a mixture of nitric, hydrofluoric and acetic acids. The nitric acid oxides the surfaces to give a thin layer of silicon dioxide – which the hydrofluoric acid immediately dissolves away to leave a clean silicon surface – and the acetic acid controls the reaction rate. The result of all this refining and treating is an even smoother and cleaner surface.
STEP FOUR:
In many of the subsequent steps, the electrical properties of the wafer will be modified through exposure to ion beams, hot gasses and chemicals. But this needs to be done selectively to specific areas of the wafer in order to build up the circuit. A multistage process is used to create an oxide layer in the shape of the required circuit features. In some cases, this procedure can be achieved using ‘photoresist’, a photosensitive chemical not dissimilar to that used in making photographic film (just as described in steps B, C and D, below).
Where hot gasses are involved, however, the photoresist would be destroyed, making another, more complicated method of masking the wafer necessary. To overcome the problem, a patterned oxide layer is applied to the wafer so that the hot gasses only reach the silicon in those areas where the oxide layer is missing. Applying the oxide layer mask to the wafer is a multistage process, as illustrated as follows.
(A) The wafer is heated to a high temperature in a furnace. The surface layer of silicon reacts with the oxygen present to create a layer of silicon dioxide.
(B) A layer of photoresist is applied. The wafer is spun in a vacuum so that the photoresist spreads out evenly over the surface before being baked dry.
(C) The wafer is exposed to ultraviolet light through a photographic mask or film. This mask defines the required pattern of circuit features. This process has to be carried out many times, once for each chip or rectangular cluster of chips on the wafer. The film is moved between each exposure using a machine called a ‘stepper’.
(D) The next stage is to develop the latent circuit image. This process is carried out using an alkaline solution. During this process, those parts of the photoresist that were exposed to the ultraviolet soften in the solution and are washed away.
(E) The photoresist isn’t sufficiently durable to withstand the hot gasses used in some steps, but it is able to withstand hydrofluoric acid, which is now used to dissolve those parts of the silicon oxide layer where the photoresist has been washed away.
(F) Finally, a solvent is used to remove the remaining photoresist, leaving a patterned oxide layer in the shape of the required circuit features.
STEP FIVE:
The fundamental building block of a processor is a type of transistor called a MOSFET. There are “P” channels and “N” channels. The first step in creating a circuit is to create n-type and p-type regions. Below is given the method Intel uses for its 90nm process and beyond:
(A) The wafer is exposed to a beam of boron ions. These implant themselves into the silicon through the gaps in a layer of photoresist to create areas called ‘p-wells’. These are, confusingly enough, used in the n-channel MOSFETs.
A boron ion is a boron atom that has had an electron removed, thereby giving it a positive charge. This charge allows the ions to be accelerated electrostatically in much the same way that electrons are accelerated towards the front of a CRT television, giving them enough energy to become implanted into the silicon.
(B) A different photoresist pattern is now applied, and a beam of phosphorous ions is used in the same way to create ‘n-wells’ for the p-channel MOSFETs.
(C) In the final ion implantation stage, following the application of yet another photoresist, another beam of phosphorous ions is used to create the n-type regions in the p-wells that will act as the source and drain of the n-channel MOSFETs. This has to be carried out separately from the creation of the n-wells because it needs a greater concentration of phosphorous ions to create n-type regions in p-type silicon than it takes to create n-type regions in pure, un-doped silicon.
(D) Next, following the deposition of a patterned oxide layer (because, once again, the photoresist would be destroyed by the hot gas used here), a layer of silicon-germanium doped with boron (which is a p-type material) is applied.
That’s just about it. I know this is long and torturous but we did say there were approximately three hundred steps in producing a chip.
OVERALL SUMMARY:
The way a chip works is the result of how a chip’s transistors and gates are designed and the ultimate use of the chip. Design specifications that include chip size, number of transistors, testing, and production factors are used to create schematics—symbolic representations of the transistors and interconnections that control the flow of electricity though a chip.
Designers then make stencil-like patterns, called masks, of each layer. Designers use computer-aided design (CAD) workstations to perform comprehensive simulations and tests of the chip functions. To design, test, and fine-tune a chip and make it ready for fabrication takes hundreds of people.
The “recipe” for making a chip varies depending on the chip’s proposed use. Making chips is a complex process requiring hundreds of precisely controlled steps that result in patterned layers of various materials built one on top of another.
A photolithographic “printing” process is used to form a chip’s multilayered transistors and interconnects (electrical circuits) on a wafer. Hundreds of identical processors are created in batches on a single silicon wafer. A JPEG of an INTEL wafer is given as follows:

Once all the layers are completed, a computer performs a process called wafer sort test. The testing ensures that the chips perform to design specifications.
After fabrication, it’s time for packaging. The wafer is cut into individual pieces called die. The die is packaged between a substrate and a heat spreader to form a completed processor. The package protects the die and delivers critical power and electrical connections when placed directly into a computer circuit board or mobile device, such as a smartphone or tablet. The chip below is an INTEL Pentium 4 version.
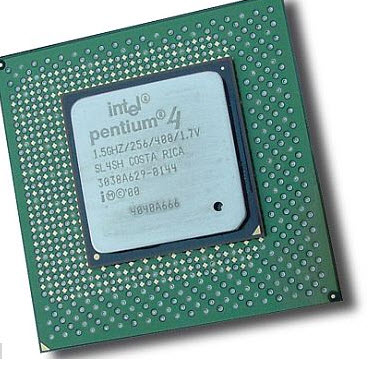
Intel makes chips that have many different applications and use a variety of packaging technologies. Intel packages undergo final testing for functionality, performance, and power. Chips are electrically coded, visually inspected, and packaged in protective shipping material for shipment to Intel customers and retail.
CONCLUSIONS:
Genius is a wonderful thing and Dr. Gordon E. Moore was certainly a genius. I think their celebrity is never celebrated enough. We know the entertainment “stars”, sports “stars”, political “want-to-bees” get their press coverage but nine out of ten individuals do not know those who have contributed significantly to better lives for us. People such as Dr. Moore. Today is the funeral of Caius Clay; AKA Muhammad Ali. A great boxer and we are told a really kind man. I have no doubt both are true. His funeral has been televised and on-going for about four (4) hours now. Do you think Dr. Moore will get the recognition Mr. Ali is getting when he dies? Just a thought.
EINSTEIN-ROSEN BRIDGE
June 8, 2016
There is a great deal of talk lately about a manned trip to Mars, the “red” planet. Let’s take a very quick look at the task to get a feel for the complexity.
- In theory, the closest distance from Earth to Mars would be when Mars is closest to the sun (perihelion) and Earth is farthest from the sun(aphelion). This would put the planets only 9 million miles(54.6 million kilometers). The two planets are farthest apart when they are both farthest from the sun, on opposite sides of the star. At this point, they can be 250 million miles (401 million km) apart. The average distance between the two planets is 140 million miles (225 million km). You would, obviously, launch when Earth and Mars are closest to each other or when they would be closest to each other.
- Light travels at approximately 186,282 miles per second(299,792 km per second). Therefore, a light shining from the surface of Mars would take the following amount of time to reach Earth (or vice versa):
- Closest approach: 182 seconds, or just over 3 minutes
- Farthest approach: 1,342 seconds, or just over 22 minutes
- On average: 751 seconds, or just over 12.5 minutes
If you could travel at the speed of light, it would be a quick trip indeed.
- Here is a list of how long it took several historical missions to reach the red planet. Their launch dates are included for perspective.
- Mariner 4, the first spacecraft to go to Mars (1964 flyby): 228 days
- Mariner 6 (1969 flyby): 155 days
- Mariner 7 (1969 flyby): 128 days
- Mariner 9, the first spacecraft to orbit Mars (1971): 168 days
- Viking 1, the first U.S. craft to land on Mars (1975): 304 days
- Viking 2Orbiter/Lander (1975): 333 days
- Mars Global Surveyor(1996): 308 days
- Mars Pathfinder (1996): 212 days
- Mars Odyssey(2001): 200 days
- Mars Express Orbiter (2003): 201 days
- Mars Reconnaissance Orbiter (2005): 210 days
- Mars Science Laboratory(2011): 254 days
- Like other space travels, zero gravity poses the biggest risk for human beings. Experts feel artificial gravity will be necessary for the crew whenever possible during the Mars mission. The health hazards are both physical as well as psychological. Improper blood circulation, space sickness, weak immune system, back aches, muscle loss and radiation are some of the physical problems one will face. Psychological problems range from depression, interpersonal conflicts, anxiety, insomnia and even psychosis.
- Dutch-based Mars One project is a ‘not for profit foundation that will establish a permanent human settlement on Mars in 2023′, aiming to add more crew to the human colony every two years subsequent. This year 40 people will be chosen for the project and four of these (two men and two women) is likely to be sent to send to Mars in September 2022, to land in April 2023. This means a journey of nearly 8 months to cover a distance of 56 mn kms. Now, this is the plan at this time. Only time will tell as to the actual delivery of those plans.
- In spite of the risks of space travel, the Mars One founder said he is convinced of the viability of the project. However, some space travel experts have said the risks are far too high to carry out these manned missions to Mars, a distance that humans have never traveled.
Radiation is a big concern. NASA does not allow their astronauts to expose themselves to radiation levels that could increase their risk of developing cancer by more than 3%.
OK, it’s a long way, but what if you could “slip the surely bonds of earth” and travel through a worm-hole that reduced you travel time to mere minutes if not seconds? This might take an Einstein-Rosen Bridge.
EINSTEIN-ROSEN BRIDGE (WORMHOLE):
A wormhole is a theoretical passage through space-time that could create shortcuts for long journeys across the universe. Wormholes are predicted by the theory of general relativity. But be wary: wormholes bring with them the dangers of sudden collapse, high radiation and dangerous contact with exotic matter. In 1935, physicists Albert Einstein and Nathan Rosen used the theory of general relativity to propose the existence of “bridges” through space-time. These paths, called Einstein-Rosen bridges or wormholes, connect two different points in space-time, theoretically creating a shortcut that could reduce travel time and distance. The JPEG below will give you some idea, graphically, as to the concept.

Wormholes contain two mouths, with a throat connecting the two. The mouths would most likely be spheroidal. The throat might be a straight stretch, but it could also wind around, taking a longer path than a more conventional route might require. Einstein’s theory of general relativity mathematically predicts the existence of wormholes, but none have been discovered to date. A negative mass wormhole might be spotted by the way its gravity affects light that passes by. Certain solutions of general relativity allow for the existence of wormholes where the mouth of each is a black hole. However, a naturally occurring black hole, formed by the collapse of a dying star, does not by itself create a wormhole.
A HUGE problem with wormholes comes from stability. The predicted Einstein-Rosen wormholes would be useless for travel because they collapse quickly. But more recent research found that a wormhole containing “exotic” matter could stay open and unchanging for longer periods of time. Exotic matter, which should not be confused with dark matter or antimatter, contains negative energy density and a large negative pressure. Such matter has only been seen in the behavior of certain vacuum states as part of quantum field theory. If a wormhole contained sufficient exotic matter, whether naturally occurring or artificially added, it could theoretically be used as a method of sending information or travelers through space.
Wormholes may not only connect two separate regions within the universe, they could also connect two different universes. Similarly, some scientists have conjectured that if one mouth of a wormhole is moved in a specific manner, it could allow for time travel. However, British cosmologist Stephen Hawking has argued that such use is not possible.
CONCLUSION:
To get to Mars or any other planet or star system, we will have to do it the old fashion way, get in, light up, and fire the darn thing. We have the navigational technology to accomplish this task, but do we really need to get there? My first choice, let’s establish a working base on our moon. We know we can do that. We have the technology—do we have the willpower to plan that event? The Executive and Legislative branches of our Federal government are just about a visionary as a cold rock. They are much much too busy getting reelected to bother with planning. I think this has been demonstrated by our complete abdication of the manned space craft program. All advancements in past decades have been for naught unless we get back in manned space. Asking the Russians for a ride every time we need a lift to ISS is ridiculous.
As always, I welcome your comments: bobjengr@comcast.net
QUADCOPTERS
June 5, 2016
Several days ago I was walking my oldest grandson’s dog Atka. (I have no idea as to where the name came from.) As we rounded the corner at the end of our street, I heard a buzzing sound; a very loud buzzing sound. The sound was elevated and after looking upward I saw a quadcopter about one hundred feet in the air going through a series of maneuvers in a “Z” fashion. It was being operated by a young man in our “hood”, a young man of nine years. His name is Dillon; very inquisitive and always with the newest toys. The control he was using was a joy-stick apparatus with two thumb wheels on either side. Simple but effective for the flight paths he put the copter through. The JPEG below will give you some idea as to the design.(NOTE:Dillon’s copter did not have a camera in the body. He was not recording the subject matter the device flew over.)

A quadcopter, also called a quadrotor helicopter or quadrotor, is a multi-rotor helicopter, as you can see from above, lifted and propelled by four rotors. Rotor-craft lift is generated by a set of rotors or vertically oriented propellers.
Quadcopters generally use two pairs of identical fixed pitched propellers; two clockwise (CW) and two counter-clockwise (CCW). These use independent variation of the speed allowing each rotor to achieve the necessary control. By changing the speed of each rotor it is possible to specifically generate a desired total thrust and create a desired total torque, or turning force.
Quadcopters differ from conventional helicopters which use rotors capable of verifying their blades dynamically as they move around the rotor hub. In the early days of flight, quadcopters (then referred to as ‘quadrotors’) were seen as possible solutions to some of the persistent problems in vertical flight such as torque-induced control as well as efficiency issues originating from the tail rotor. The tail rotor generates no useful lift and can possibly be eliminated by counter-rotation of other blades. Also quadcopters are designed with relatively short blades which are much easier to construct. A number of manned designs appeared in the 1920s and 1930s. These vehicles were among the first successful heavier-than-air vertical takeoff and landing (VTOL)vehicles. Early prototypes suffered from poor performance and later prototypes required too much pilot work load, due to poor stability and limited control.
In the late 2000s, advances in electronics allowed the production of cheap lightweight flight controllers, accelerometers (IMU), global positioning system and cameras. This resulted in a rapid proliferation of small, cheap consumer quadcopters along with other multi rotor designs. Quadcopter designs also became popular in unmanned aerial vehicle (UAV or drone) research. With their small size and maneuverability, these quadcopters can be flown indoors as well as outdoors. Low-cost motors and mass-produced propellers provide the power to keep them in the air while light weight and structural integrity from engineered plastics provides durability. Chip-based controllers, gyros, navigation, and cameras give them high-end capabilities and features at a low cost. These aircraft are extremely useful for aerial photography. Professional photographers, videographers and journalist are using them for difficult, if not impossible, shots relative to standard means. A complete set of hardware may be seen below.

One of the most pleasing versions of a camera-equipped quadcopter is given as follows:

SAFETY:
As with any new technology, there can be issues of safety. Here are just a few of the incidents causing a great deal of heartburn for the FAA.
- At 8:51 a.m., a white drone startled the pilot of a JetBlue flight, appearing off the aircraft’s left wing moments before the jet landed at Los Angeles International Airport. Five hours later, a quadcopter drone whizzed beneath an Allegiant Air flight as it approached the same runway. Elsewhere in California, pilots of light aircraft reported narrowly dodging drones in San Jose and La Verne.
- In Washington, a Cessna pilot reported a drone cruising at 1,500 feet in highly restricted airspace over the nation’s capital, forcing the U.S. military to scramble fighter jets as a precaution.
- In Louisville, a silver and white drone almost collided with a training aircraft.
- In Chicago, United Airlines Flight 970 reported seeing a drone pass by at an altitude of 3,500 feet.
- All told, 12 episodes — including other incidents in New Mexico, Texas, Illinois, Florida and North Carolina — were recorded one Sunday of small drones interfering with airplanes or coming too close to airports, according to previously undisclosed reports filed with the Federal Aviation Administration.
- Pilots have reported a surge in close calls with drones: nearly 700 incidents so far this year, according to FAA statistics, about triple the number recorded for all of 2014. The agency has acknowledged growing concern about the problem and its inability to do much to tame it.
- So far, the FAA has kept basic details of most of this year’s incidents under wraps, declining to release reports that are ordinarily public records and that would spotlight where and when the close calls occurred.
- On March 29, the Secret Service reported that a rogue drone was hovering near a West Palm Beach, Fla., golf course where President Obama was hitting the links. Secret Service spokesman Brian Leary confirmed the incident. He declined to provide further details but said the Secret Service “has procedures and protocols in place to address these situations when they occur.”
- Two weeks later, just after noon on April 13, authorities received a report of a white drone flying in the vicinity of the White House. Military aircraft scrambled to intercept the drone, which was last seen soaring over the Tidal Basin and heading toward Arlington, Va., according to the FAA reports.
- On July 10, the pilot of an Air Force F-15 Strike Eagle said a small drone came within 50 feet of the fighter jet. Two weeks later, the pilot of a Navy T-45 Goshawk flying near Yuma, Ariz., reported that a drone buzzed 100 feet underneath.
REGULATIONS:
For public safety, the FAA has promulgated regulations that MUST be adhered to by those owning drones such as quadcopters. Anyone owning a quadcopter or drone weighing more than 0.55 pounds must register it with the Federal Aviation Administration if they intend to fly outdoors. It will cost those owners $5.00. If the copter tips the scales at over fifty-five (55) pounds, including any extra equipment or cameras attached, the FAA no longer considers it a model aircraft or a recreational Unmanned Aircraft System and a very long list of additional regulations apply. Model aircraft also cannot be used for commercial purposes or for payment. They can only be used for hobby and recreational uses. A few FAA guidelines are given as follows:
- Quadcopters or any unmanned recreational aircraft cannot be flown above four hundred (400 ) feet.
- They must remain in site of the operator.
- Quadcopters cannot fly within five (5) miles of any airport without written approval of the FAA.
- Quadcopters cannot fly over military bases, national parks, or the Washington D.C. area and other sensitive government buildings; i.e. CIA, NSA, Pentagon, etc.
- The FAA has extended the ban on planes flying over open-air stadiums with 30,000 or more people in attendance.
PRIVACY:
Privacy concerns can lead to hot tempers. Last year, a Kentucky man used a shotgun to blast a drone out of the air above his home. A New Jersey man did the same thing in 2014, and a woman in Seattle called the police when she feared a drone was peeping into her apartment. (The drone belonged to a company conducting an architectural survey.) And in November, repeated night-time over-flights by a drone prompted calls to Albuquerque police complaining of trespassing—the police concluded that the flyer wasn’t breaking any laws.
State laws already on the books offer some privacy protections, especially if a drone is shooting photos or video. Erin E. Rhinehart, an attorney in Dayton, Ohio, who studies the issue, says that existing nuisance and invasion-of-privacy statutes would apply to drone owners. If you could prove you were being harassed by a drone flying over your house, or even that one was spying on you from afar, you might have a case against the drone operator. But proof is difficult to obtain, she says, and not everyone agrees on how to define harassment.
Some states are trying to strengthen their protections. In California, nervous celebrities may benefit from a law signed by Governor Jerry Brown this past fall. The meat of the legislation reads, “A person is liable for physical invasion of privacy when the person knowingly enters onto the land or into the airspace above the land of another person without permission…in order to capture any type of visual image, sound recording, or other physical impression of the plaintiff.” And a similar privacy law in Wisconsin makes it illegal to photograph a “nude or partially nude person” using a drone. (Dozens of states have passed or are considering drone-related laws.) The point being, people do NOT like being the subject of peeping-toms. We can’t, for the most part, stand it and that includes nosey neighbors. The laws, both local, state and Federal are coming and drone users just as well need to get over it.
THE ONEROUS COST OF CONGESTION
June 4, 2016
Our two oldest granddaughters attend Georgia State University in Atlanta, Georgia. Great school and they have majors that will equip them well after graduation. (No gender studies, basket weaving or quilting classes with these two.) We visit them frequently, always enjoying our time together but dreading the commute to Atlanta. Love ‘hotlanta’ but absolutely HATE the congestion and that congestion begins about twenty (20) miles outside the city. When the Braves, Falcons, Hawks, or Gladiators (Ice Hockey) are in town the congestion is doubled. Interstate 75 is the main route to most of central Florida so summer-time travel is wonderful also. You get the picture.
This got me to thinking, what is the monetary cost of travel? Please note, I said monetary; not the cost of stress on one’s system, physical and mental. Data published in April of this year by the American Transportation Research Institute (ATRI) puts the impact of being stuck in traffic into stark terms with a single data point: traffic congestion on the U.S. National Highway System added over $49.6 billion (yes that’s with a “B”) in operational costs to the trucking industry in 2014. That’s just added shipping costs for trucks delivering goods to clients and customers. This does not include domestic agony experienced by a family of four trying to get to grandmother’s house for Thanksgiving dinner. The ATRI said congestion resulted in a calculated delay totaling more than 728 million hours of lost productivity, equaling 264,500 commercial truck drivers sitting idle for a working year. More than a dozen states experienced increased costs of over one billion dollars ($1B) each due to congestion. Traffic congestion tended to be most severe in urban areas, with eighty-eight percent (88%) of the congestion costs concentrated in only eighteen percent (18%) of the network mileage and ninety-five percent (95%) of the total congestion costs occurring in metropolitan areas. The analysis also demonstrates the impact of congestion costs on a per-truck basis, with average increased costs of $26,625 for trucks that travel 150,000 miles annually. At one time, traffic congestion was considered an indicator of growth, but above a certain threshold, congestion starts to become a huge drag on possible growth. Specifically, congestion seems to slow job growth when it gets to be worse than about thirty-five (35) to thirty-seven (37) hours of delay per commuter per year (or about four-and-a-half minutes per one-way trip, relative to free-flowing traffic). A similar threshold exists when the entire road network gets too saturated throughout the course of the day (for transportation wonks, that’s at about 11,000 ADT per lane). Above that four-and-a-half-minute threshold, however, something else happens: The quality of life of people making those commutes starts to decline. Now, if you have to spend a miserable hour or two five days a week just getting to work, you’re either going to require higher wages to compensate you, or you’re going to look for another job. And if congestion makes it harder to match the right workers to the best jobs, that’s economically inefficient, too.
When categorizing the delays impacting business, we see the following:
- Freight Delivery – market size, vehicle/fleet size, both cross-country and local
- Business Scheduling – delivery time shifts, reconfiguration of backhaul operations, use of relief drivers. Using Atlanta as an example, repair and replacement facilities, at one time, could accommodate an average of ten (10) clients per day. Now, that’s down to six (6) per day due to congestion. That’s money lost.
- Business Operations – inventory management, retail stocking, cross-docking
- Intermodal Connection Arrangements – access to truck/rail/air/sea interchange terminals. Transportation must be scheduled and delays for any reason cost firms for rescheduling.
- Worker Travel and Compensation – worker time/cost, schedule reliability, “on-the-clock” work travel
- Business Relocation Issues – smaller dispersed location strategies, moves outside of major markets, shifts to production elsewhere
- Localized Interactions with Other Activities – land use/development and costs passed on to employees.
Each of these seven classes of business delays affect specific areas of the supply chain. These systematic differences are important because they vary by industry, affect the ability of affected industries to mitigate congestion costs through work-around operational changes, and ultimately affect local economic competitiveness in different ways.
ENVIRONMENTAL CONCERNS:
Congestion also affects environmental areas. No one will be surprised to learn that areas with the largest number of cars on the road see higher levels of air pollution on average. Motor vehicles are one of the largest sources of pollution worldwide. You may be surprised to learn, however, that slower moving traffic emits more pollution than when cars move at freeway speeds. Traffic jams are bad for our air. It seems intuitive that your car burns more fuel the faster you go. But the truth is that your car burns the most fuel while accelerating to get up to speed. Maintaining a constant speed against wind-resistance burns more or less a constant amount. It’s when you find yourself in a sea of orange traffic cones — stuck in what looks more like a parking lot than a highway — that your car really starts eating up gas. The constant acceleration and braking of stop-and-go traffic burns more gas, and therefore pumps more pollutants into the air.
The relationship between driving speed and pollution isn’t perfectly linear although one study suggests that emissions start to go up when average freeway speed dips below forty-five (45) miles per hour (mph). They also start to go up dramatically as the average speed goes above 65 mph. So, the “golden zone” for fuel-consumption and emissions from your vehicle may be somewhere between 45 and 65 mph. Stopping and starting in traffic jams burns fuel at a higher rate than smooth rate of travel on the open highway. This increase in fuel consumption costs commuters additional money for fuel and contributes to the amount of emissions released by the vehicles. These emissions create air pollution related to global warming.
This leads to a dilemma for urban planners trying to develop roadways that will reduce congestion with an eye to reducing the pollution that it causes. Laying out the traffic cones for massive freeway expansion projects sends air-quality plummeting, but the hope is that air-quality will improve somewhat once the cones are gone and everyone is cruising along happily at regular freeway speeds. Ironically, since the average freeway speeds for non-congested traffic hover around seventy (70) mph and above (with states like Texas looking to increase their speed limits), air-quality is unlikely to improve — and may actually worsen — once those highway improvements are finished.
ROAD RAGE:
This is horrible but we see news releases everday concerning drivers that just “lose” it. Eight out of ten drivers surveyed in the AAA Foundation’s annual Traffic Safety culture Index rank aggressive driving as a “serious” or “extremely serious” risk that jeopardizes their safety. Although “road rage” incidents provide some of the most shocking views of aggressive driving, many common behaviors, including racing, tailgating, failing to observe signs and regulations, and seeking confrontations with other drivers, all qualify as potentially aggressive behaviors. Speeding is one of the most prevalent aggressive behaviors. AAA Foundation studies show that speeding is a factor in one-third of all fatal crashes.
Despite a strong public awareness and understanding of aggressive driving, many people are willing to excuse aggressive behaviors. Half of all drivers in our Traffic Safety Culture Index admitted to exceeding both neighborhood and highway speed limits by more than fifteen percent (15%) in the past thirty (30) days. More remarkable, a quarter of drivers say they consider speeding acceptable. Much of the road rage we see results from having been in bumper-to-bumper traffic previously. THAT is a proven fact.
CONCLUSIONS:
Traffic hurts—our economy, our environment, our relationships with family and coworkers, and physical health. As always, I welcome your comments.


PANAMA CANAL EXPANSION AND US PORTS
June 26, 2016
THE REVISED PANAMA CANAL:
The Panama Canal expansion is scheduled for completion late this month (27 June) and with that being the case, additional inbound cargo is destined for the United States. The ships for which the canal was designed are now long gone. Modern shipping has increased the size of ships and increased the tonnage which can be carried. This has created significant issues for the “old” canal structure. The older version of the canal can only accommodate ships carrying up to 65,000 tons of cargo, but recently ships which are able to carry 300,000 tons have been introduced. Despite the limit in ship size, the canal is still one of the most highly travelled waterways in the world, handling over 12,000 ships per year. The fifty-one (51) mile crossing takes about nine hours to complete, an immense time saving when compared with rounding the tip of South America
The problem of the ever-increasing size in ships started questions into construction of a new canal joining the Pacific and Atlantic oceans. There have been discussions on three alternative routes for a new canal, through; Columbia, Mexico and Nicaragua. The Columbian and Mexican routes would allow for the construction of a sea level canal, whereas the Nicaraguan route would require a lock system.
If we look at the scope of the task, we see an immense project digging through landscape to connect two oceans. The following map will indicate the herculean task that is being performed.
The next two digital photographs will show the massive construction project and what had to be accomplished to bring about the completed renovations.
The Set of Locks Project, will double the capacity of the Panama Canal by (1) adding a new lane of traffic allowing for a larger number of ships, and (2) increasing the width and depth of the lanes and locks allowing larger ships to pass. The new larger ships, called New Panamax, are about one and a half times the current Panamax size vessels and can carry over twice as much cargo. The existing canal was sufficient for its time but newer vessels with longer and wider dimensions dictate improvements.
The project has:
As mentioned, expansion will reconfigure trans-American shipping. A much higher volume of goods will move faster between the two oceans, decreasing transport costs and altering the delicate financial calculus that determines global shipping routes. As canal traffic increases, there will be a corresponding rise in transshipment, where goods are transferred to smaller ships that service cities with shallower harbors. The canal’s three ports — Balboa, Colón, and Manzanillo — will link distribution centers like Shanghai with smaller hubs like Barranquilla, Colombia, thus increasing Panama’s importance to regional shipping networks. This expansion will provide an attractive alternative for shipping agricultural products from the interior United States to East Asian markets, elevating the Mississippi River corridor relative to the currently dominant overland routes to Pacific ports.
OK, how with improvements in the canal affect ports in the United States and the population of the United States?
US PORTS:
Almost every time we get on an interstate highway or major road, we see the most visible cogs in the U.S. distribution system — tractor-trailer trucks. And anyone who’s ever been stuck for several minutes waiting for a long freight train to pass can appreciate how much freight moves on U.S. railroads. But most Americans would be astounded at the amount of freight that moves through a few dozen ports along the East and West coasts and some of the country’s major waterways. The numbers are staggering: the equivalent of 28.74 million containers measuring twenty (20) feet long by eight (8) feet wide by 8.5 feet high passed through the thirty (30) busiest U.S. ports in 2009 (the latest year for which statistics are available). If those containers were stacked end to end, they’d stretch some 111,000 miles, nearly half the distance to the moon. Let’s take a look at the twenty-five (25) busiest ports in the United States. Here we go:
CONCLUSION:
I decided to post this information to indicate the “new” Panama Canal is open for business with this fact being addressed by the following press release:
“The $5 Billion Panama Canal Expansion Opens Sunday, Amidst Shipping Concerns, June 25, 20166:14 PM ET”
This remarkable engineering feat joins east with west to provide (hopefully) less costly goods to consumers the world over. It also aids efforts for countries in South America to participate with “first-world” countries for supply and demand. For me, it demonstrates that willingness to envision and plan are still alive and well in the world today. In times with investment money is remarkably tight, it’s good to remember patience has its own reward. Also, this is good for engineering and has provided over the years many jobs for planners and engineering “types” the world over!
As always, I welcome your comments. B.
Share this:
Tagged: Commentary, Knowledge economy