ENGINEERING SALARY SURVEY—2013—DEMOGRAPHICS
September 1, 2013
We all would enjoy knowing if our compensation package and working conditions are comparable with others within our profession. Each year, Design News Magazine conducts a survey to determine the “state” of the engineering profession relative to salary, demographics and overall satisfaction for practicing engineers. In June of 2013, the Design News team sent an e-mail invitation to 190,341 North American members of the Design-Engineering community. A firm called Explorations and Insights, LLC designed and executed the study; Research Results, an independent research firm, tabulated the data. The survey conducted and evaluated compensation and job satisfaction relative to the following areas:
- Current salary and bonus as compared to one year ago
- Length of employment
- Engineering disciplines
- Level of job stress as compared to one year ago
- Reasons for job stress
- Impact of economy
- Level of supervisory and/or budgetary responsibility as compared to one year ago
- Average number of work hours per week
- Level of satisfaction as a design engineer
- Reasons for job satisfaction or dissatisfaction
- Challenges of the job
- Size of company
- Company’s major product line
The results are based upon 2,125 usable survey responses. At a 95 % confidence level, the results are accurate and projectable with a + or – 2.1% margin of error.
Since the results of the survey are lengthy, I have divided the commentary into three (3) parts as follows:
- Salary
- Demographics
- Job Satisfaction
Our subject this time will be “DEMOGRAPHICS” and involves subjects such as: 1.) How many hours per week do you work, 2.) Educational background, 3.) How long have you been an engineer, 4.) Number of employees supervised 5.) Supervisory responsibility and several others. In other words, we get to know the “average-typical” engineer during his or her working life. We will now basically summarize what we discussed with the first posting as follows:

Let’s take a closer look.
As you can see, the overwhelming number of practicing, “blue-collar “engineers have a Bachelors degree in engineering; twenty-four percent (24%) with a masters and three percent (3%) with a doctorate. Most individuals with doctorates find themselves in teaching professions or research departments. One field that has always contributes greatly, in my opinion, to the engineering profession is the two year graduate coming from technical schools. One omission—how many practicing engineers have PE licenses? I would love to know this number but it was not in the questions asked. Maybe next year.

I must admit I am surprised with the next chart. The average number of years worked– eighteen with fifty-five percent (55%) having over twenty years of experience. I think the “take-a-way” here is many engineers go on to other professions and / or management positions. Those who stay with it do so for a lengthy period of time.
Another surprise, thirty-three percent 33%) of those responding indicated they were electronics engineers. Thirty percent (30%) are mechanical types. After this, the numbers fall off appreciably.

I read an article some months ago that stated the average length of time for employment at any one company was four years. Engineers definitely do not job hop. As you can see, the average length of time was nine (9) years with fifty-three percent (53%) being over ten (10) years. Twenty-three percent (23%) had over twenty (20) years with their present company. With the cost of training employees, I am sure the “staying power” of engineering talent is appreciated.

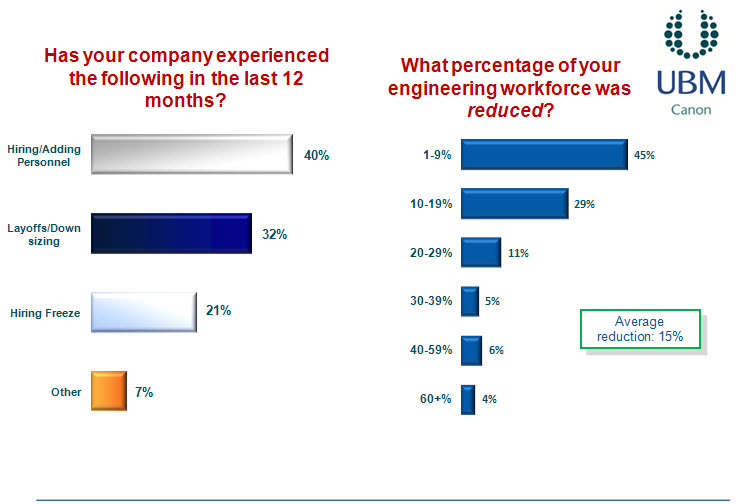
As you well know, our economy had taken a beating during the last several years but there appears to be a moderate comeback, at least for engineering talent. This is borne out by the chart below. There have been layoffs and downsizing but hiring and adding personnel has also occurred. On average, thirteen (13%) increase in personnel occurred during the 2012 year. I might note that the unemployment rate for graduate engineers is much smaller than the workforce in general. The thing that hurts engineering employment is outsourcing, primarily to China, India and the Middle East.
The next chart is disturbing; on average fifteen percent (15%) of individuals responding indicated there was a reduction in force within their company. Not good! Again, outsourcing and the economy are two factors to blame for this occurrence.
By law, compensation, even for engineering talent, must be paid for any time worked over forty-eight hours on a weekly basis. Rarely does this occur because most engineers are non-union. That’s as it should be in my opinion. The hours worked has not appreciably changed from 2012.

In looking at the chart below, you can see the various product lines supporting engineering talent. I would love to see a breakdown of the category “other”. It would be good to know that.

There is absolutely no doubt those smaller companies carry our economy and the engineering work force is concentrated with companies with employees less than one hundred. Another very interesting fact, in looking at company size vs. the number of engineers per company, you can see the smaller companies have proportionately greater engineering staffs. This is to be expected.

Company size being home for engineering talent would dictate a smaller number of engineers for engineering managers to manage. That can be seen as follows:
Fifty-five percent (55%) of engineers have no P&L responsibilities at all with twenty-two percent(22%) having both supervisory and budgetary responsibilities. This has not changed that much from 2012 numbers.

And now the big question—-would you recommend the engineering profession to your son or daughter. Surprisingly enough, eighty-four percent (84%) said yes. This is not due to money, time spent on the job, or job assignment. It’s solely due to the nature of engineering.

Our next posting will look at engineering satisfaction with the profession in general. This one was a real eye-opener for me.


JOB SATISFACTION AMOUNG ENGINEERS–2013
September 22, 2013
Each year, Design News Magazine conducts a survey to determine the “state” of the engineering profession relative to salary, demographics and overall satisfaction for practicing engineers. In June of 2013, the Design News team sent an e-mail invitation to 190,341 North American members of the Design-Engineering community. A firm called Explorations and Insights, LLC designed and executed the study; Research Results, an independent research firm, tabulated the data. The survey conducted and evaluated compensation and job satisfaction. The results are based upon 2,125 usable survey responses. At a 95 % confidence level, the results are accurate and projectable with a + or – 2.1% margin of error. We will take a look at Job Satisfaction with this last posting relative to the survey.
Results of the survey are given below and show most working, blue-collar engineers still love to solve problems and find viable solutions to “fix what’s broken”. Seventy-three percent (73%) of the responses indicated that problem solving is the best part of the profession with seventy-one percent (71%) loving the technical challenges they are given. As you can see, there is a down-side. Room for advancement is a significant problem in the profession. I think most engineers feel room for advancement in the profession and not into management.
The pie chart below gives another viewpoint.
Fifty-six percent (56%) are extremely or very satisfied with the positions the work they do on a daily basis even though there are definite concerns relative to employment. Take a look.
The economy has left and is leaving many engineers with feelings of insecurity with only seven percent (7%) with no worries at all. Twenty percent (20%) are very concerned about future employment. The possibility of company closure or downsizing is a definite worry for many engineers.
Clearly, fifty-five percent (55%) are concerned. Even with this being the case, very few are actively seeking another job.
Twenty-one percent (21%) are very happy with their present positions but thirty-two percent (32%) indicate they are always open to better circumstances.
Overall, the engineering profession seems to be fairly satisfied but with definite concerns relative to future employment and finding a job if losing the one they have. I suppose in the times we live, this is to be expected.
Share this: